How to Calculate Vending Machine Profit (USA-Specific Formula)
How to Calculate Vending Machine Profit (USA-Specific Formula) — the line-by-line model real American operators use.
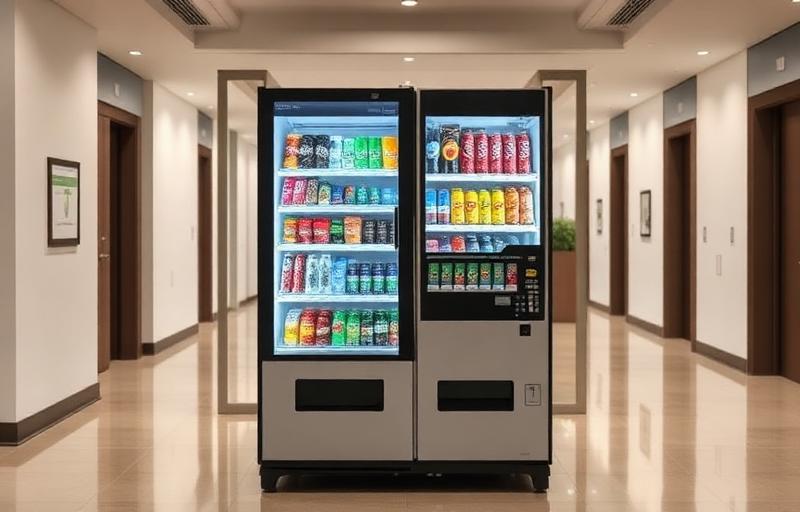
Most vending profit calculators are wrong because they skip the lines that actually move the number. The honest USA formula is: Gross Sales − Sales Tax − COGS − Commission − Card Reader Fees − Route Costs − Allocated Overhead = Net Profit. Skip any one of those lines and you'll overestimate the deal.
Start with gross sales. For a new USA placement, estimate based on daily foot traffic: assume 3% to 8% of daily visitors will purchase, at an average vend price of $2.00 to $2.50. A 200-person office at a 5% capture rate averages 10 vends per day, or roughly 200 per month, for $400 to $500 of gross. That's your top line — every other number is subtracted from it.
Across the USA, demand concentrates in a handful of high-growth metros. Operators report the strongest unit economics in Texas, Florida, California, Georgia, Arizona, North Carolina, with standout suburban pockets like Plano, TX, Frisco, TX, The Woodlands, TX, Doral, FL, Coral Gables, FL, Alpharetta, GA consistently outperforming national averages. Capture rates vary by location type and region. American manufacturing plants and warehouses average 8% to 12% capture. Office placements average 3% to 6%. Fitness centers average 4% to 7% but at higher ticket prices (energy drinks, protein bars).
Subtract sales tax next, not last. USA vending sales are taxable in most states at the state + local combined rate (typically 6% to 9%). The trap is forgetting that the customer pays the posted price — the operator absorbs the tax out of gross. A $2.00 vend in a 8% sales tax jurisdiction nets $1.85 to the operator before any other costs are considered.
Cost of goods is the next line. For USA snack and drink placements, COGS typically runs 35% to 45% of gross sales depending on product mix and wholesale sourcing. Operators who source from Sam's Club, Costco Business, and Restaurant Depot consistently land at the low end of that range. Operators who source from regional foodservice distributors at full markup land at the high end.
Commission to the location host is the line that most operators model wrong. American hosts negotiate commissions in two flavors: percentage of gross (most common, 0% to 25%) or fixed monthly rent (less common, $50 to $500/month for premium placements). Always model commission against gross sales after sales tax has been removed — that's the honest base.
Card-reader fees in the USA are a SaaS line plus a percentage line. Nayax and Cantaloupe both charge roughly $8 to $12 per month per machine plus 5.5% to 6% of cashless transaction volume. Since cashless is over 70% of vends in American placements, the effective drag on gross revenue is roughly 4% — material enough to break a marginal placement.
Route costs are the line operators forget entirely. Fuel, vehicle depreciation, and your own labor at a fair hourly rate are real costs. For a USA operator running a 30-mile route, restocking once a week, the loaded cost per machine per month is typically $25 to $50. On a $400/month machine that's 6% to 12% of gross — not catastrophic but absolutely not zero.
Allocated overhead — insurance, business banking, accounting, telemetry SaaS — typically runs $40 to $80 per machine per month for a USA route of 10 to 50 units. Operators with single-digit machine counts pay disproportionately more per unit; this is one of the structural reasons vending scales better than most small businesses once you cross the 15-machine threshold.
Once you've mapped your numbers, plug them into our free ROI Calculator at /roi-calculator to pressure-test the deal. For multi-machine routes, financing scenarios, and 5-year projections, the Premium ROI tools on the same page give you the lender-ready view.